 |
| Figure 1. Chart of California Population 1900-2016 |
 |
| Figure 2. California Population Rate of Growth, 1900-2016 |

It's ironic now in 2016 that these inland counties forecast for high population growth have some of the worst drought-related problems in the state. Another connection: the California Energy Code Title 24.6 focuses especially on new tract housing in these warmer inland climate zones.
However, something's not right. If you look at the CA Dept. of Finance numbers in a spreadsheet and back out their assumed growth rates, they are unexpectedly high: above 0.7% through 2040 and 0.5% in the two decades after. What's the basis of these high rates? They have no relationship to the trend data. Mainstream economic models appear to not handle negative growth, so it makes sense that the California Department of Finance would just assume a small positive number for future projections, in lieu of zero or negative. How about instead, we extend the trend growth rate linearly through zero to negative. This fits the data, and fits the headlines. Here is a comparison chart of the two different growth rate scenarios:
 |
| Figure 3. Comparison of CA Dept. of Finance Projection with Trend Rate |
 |
| Figure 4. Comparison of Estimates of Future California Population |
I'm inclined to believe the declining curve rather than the Dept. of Finance projection, because it seems more supported by widespread evidence:
1) For example, look at this study showing fewer babies since the Great Recession, "The Hidden Cost of the Recession: Two Million Fewer Births and Still Counting [PDF]":
Professor Johnson calculated that if births had continued at the pre-recession rate, Americans would have had 3.4 million additional babies in 2008–2015. He found no evidence to suggest that this trend changed in 2016, so the total is likely near 4 million by now. (link)

2) Young people don't have high-enough paying jobs, can't afford housing, have big college loans, and are living at home. In December 2014 the LA Times reported "California millennials living longer with parents, marrying less". Will they be having lots of babies while living at home? It's possible. We had our second child while living with parents! We couldn't afford mortgage & childcare & property tax on our two incomes. :-)
3) Corresponding to these headlines, the Dept. of Finance E-2 data actually show that the residents' natural rate of increase (births minus deaths) has plunged since the 2009 recession:
 |
| Figure 5. Natural Increase = Births minus Deaths of resident population |
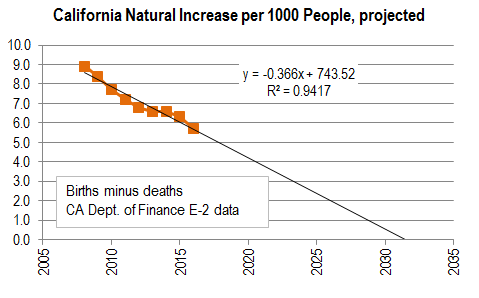 |
| Figure 6. Trend Projection to California "Natural Increase" going Negative |
 |
| Figure 7. Components of California Population Change 2000-2016 |
 |
| Figure 8. Comparison of Forecasts for Persons Added in California 2020-2060. |
Now what do you want to invest money in? Health care for the elderly! :-)
What factors would need to change to make this prediction wrong?
The decline in birthrates is happening all over the industrialized world, with Japan in the lead. Read more about demographics at Econimica. Why are birthrates declining? Theory: Because of diminishing returns on human labor. Young people are finding that it requires two incomes to support a lower standard of living than their parents had from one income. The fundamental reason for diminishing returns on labor may be that industrialized countries have been unable since the 1970s to continue leveraging increasingly inexpensive energy sources (petroleum) to improve labor productivity, and this decline has increased since 2000. At the same time, cost of living has shot up due to asset price inflation. Read more about the energetic basis for falling returns on human labor at Our Finite World.
Economists and banks seem upset about demographic slowdown and reversal. There will be fewer consumers to take out new loans and support asset prices.
My take is this: Population contraction is great news! Fantastic! Whew, what a relief that it's finally here! Thank goodness that crazy petroleum interlude is coming to an end. We'll be able to spend more time with family. There may be a resurgence of wildlife. Air quality may improve. The stars may shine brighter.
4 comments:
Outstanding work! I commend your efforts to bring analytic tools and frankly, common sense, to this idea that California will grow, Grow, GROW! forever.
I will be linking to this excellent analysis from my own blog.
I have posted some analyses on similar issues here:
Limits to Growth - http://meetingthetwain.blogspot.com/2017/04/limits-to-growth.html
Density and the Environment - http://meetingthetwain.blogspot.com/2017/12/building-density-and-environment.html
End of Oil - http://meetingthetwain.blogspot.com/2017/08/end-of-oil.html
Thanks Michael, I look forward to reading these. Dan
The year is now 2022 and we're facing brownouts and "emergency measures," over grid inadequacy
Along with roulette, you'll be able to|you probably can} play 1,200-plus different on line casino video games, and the party starts with a one hundred 코인카지노 pc up to as} one bitcoin welcome bonus. Once you're in entrance of the roulette wheel, you may wonder whether you have chosen the most effective roulette game. However, when you play online roulette at the most effective roulette game websites, you may see that your life will be made easier through various data on the completely different variations of the game. In a conclusion, we will to} actually say that half in} roulette online is way higher than half in} at a land-based on line casino. First of all, on the Internet, may have} far more roulette variations select from|to select from}. This helps all players choose on} the easiest model which suits their preferences essentially the most.
Post a Comment